Nerding Out on the Hydrograph
January 16, 2017 | By Shoal Creek Conservancy
This blog post was written by Andy Sobchak. To learn more about the author, please visit this site.
Let’s take a moment to examine the humble hydrograph. It’s a critical element of watershed management, but it is also a neat way for anyone to visualize how a watershed responds to rainfall.
As the name implies, a hydrograph is simply a line graph depicting water flow over time at a specific location. Hydrographs can be measured by, for example, an automated gauge like the USGS operates on Shoal Creek at W. 12th Street, or they can be modeled using software. A hydrograph can be measured or modeled at any number of locations, including the mouth of Shoal Creek at Lady Bird Lake, a storm sewer outfall from an existing neighborhood, or the outlet of a stormwater management pond designed to control runoff from a new subdivision. And each hydrograph tells a different story; each is a “fingerprint” of the contributing watershed area.
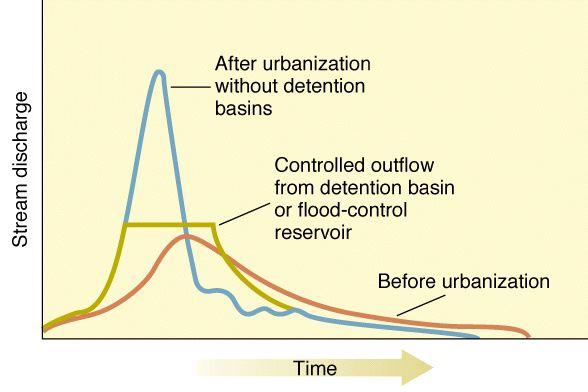
As shown in the graphic below, the shape of a hydrograph is telling. Hydrographs which build and recede slowly suggest the upstream watershed has a relatively large proportion of natural cover, like trees or grass which moderate the rate of runoff. As the proportion of hard surfaces (e.g., roofs, roads, sidewalks, parking lots, etc.) increases through urbanization, rainfall runs off more quickly and in greater quantity, contributing to a hydrograph which peaks higher and sooner than a natural counterpart.
Water resources engineers are often called in to design facilities which manipulate a catchment’s runoff hydrograph. In the case of a new subdivision, a stormwater management pond may be built to throttle back peak runoff from newly urbanized areas so its post-development hydrograph better mimics the catchment’s predevelopment hydrograph. From a peak flow perspective, this means there should be no negative impacts downstream.
In my October blog post, I mentioned how the manipulation of runoff timing can sometimes alleviate flooding issues. Let’s look at an example along Shoal Creek to illustrate this concept: Imagine three hydrographs were modeled at locations as shown in the below map: 1) in the main branch of Shoal Creek just upstream of the confluence with the Hancock Branch, 2) in the Hancock Branch just upstream of the confluence, and 3) in Shoal Creek downstream of the confluence at W. 45th Street. Imagine now that hydrographs #1 and #2 peak at the same time with the same flow rate. When these two flow regimes combine, the peak flow at #3 is additive and flooding issues downstream could very likely occur.
If water resources engineers could delay the peak of Hydrograph #1 by implementing green infrastructure (e.g., bioswales, green roofs, etc.) in the upstream watershed area or reduce the peak by implementing storage controls like stormwater management ponds, there is a chance flow from the Hancock Branch could slip through the confluence before the peak from the main channel arrived, reducing or eliminating downstream flooding.
Runoff timing is a critical element of flood management. Hydrographs help us visualize that timing and investigate its impact.
If you’d like to learn more about hydrographs, how catchment size, shape, slope and soils all affect them, the BBC has created a fun tutorial on their BBC Bitesize website. It even has a 7-question quiz if you are up for the challenge!
